User Insights
PropelAuth User Insights give you a look into your company's user base - how much it's growing, and how active your users are (or aren't).
Metrics
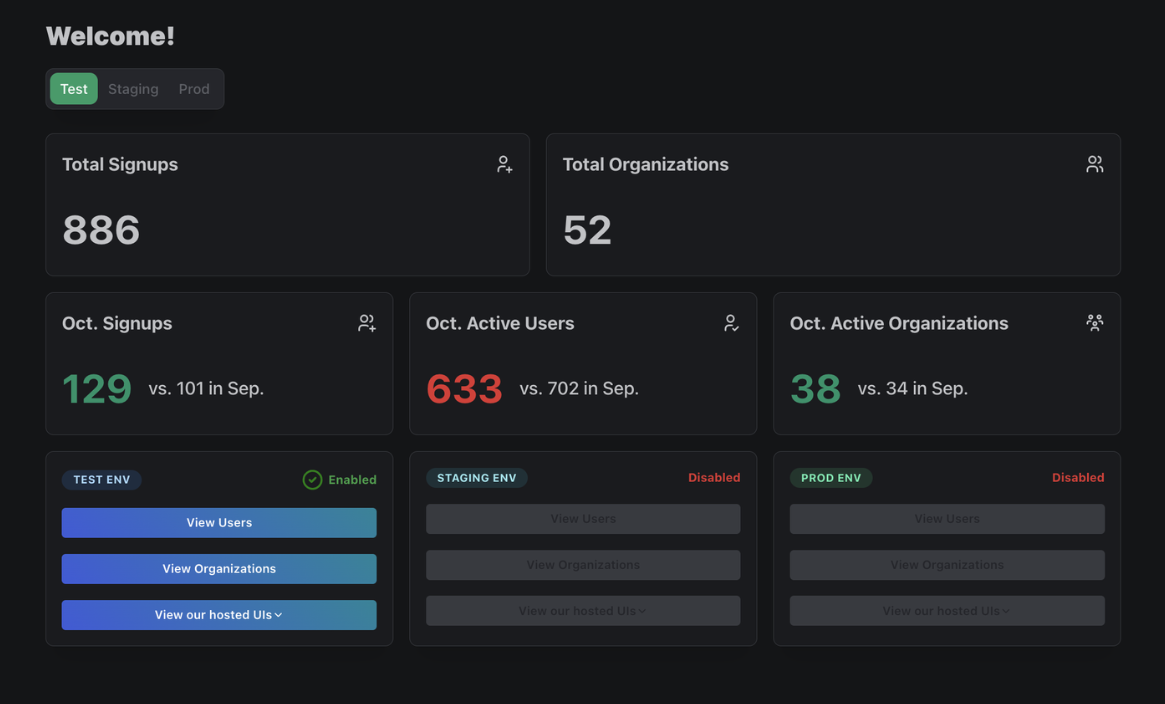
The PropelAuth dashboard will display a set of basic metrics:
- Total Signups
- Total Organizations
- Signups this month vs signups last month
- Active users this month vs active users last month
- Active organizations this month vs active organizations last month
User Insights
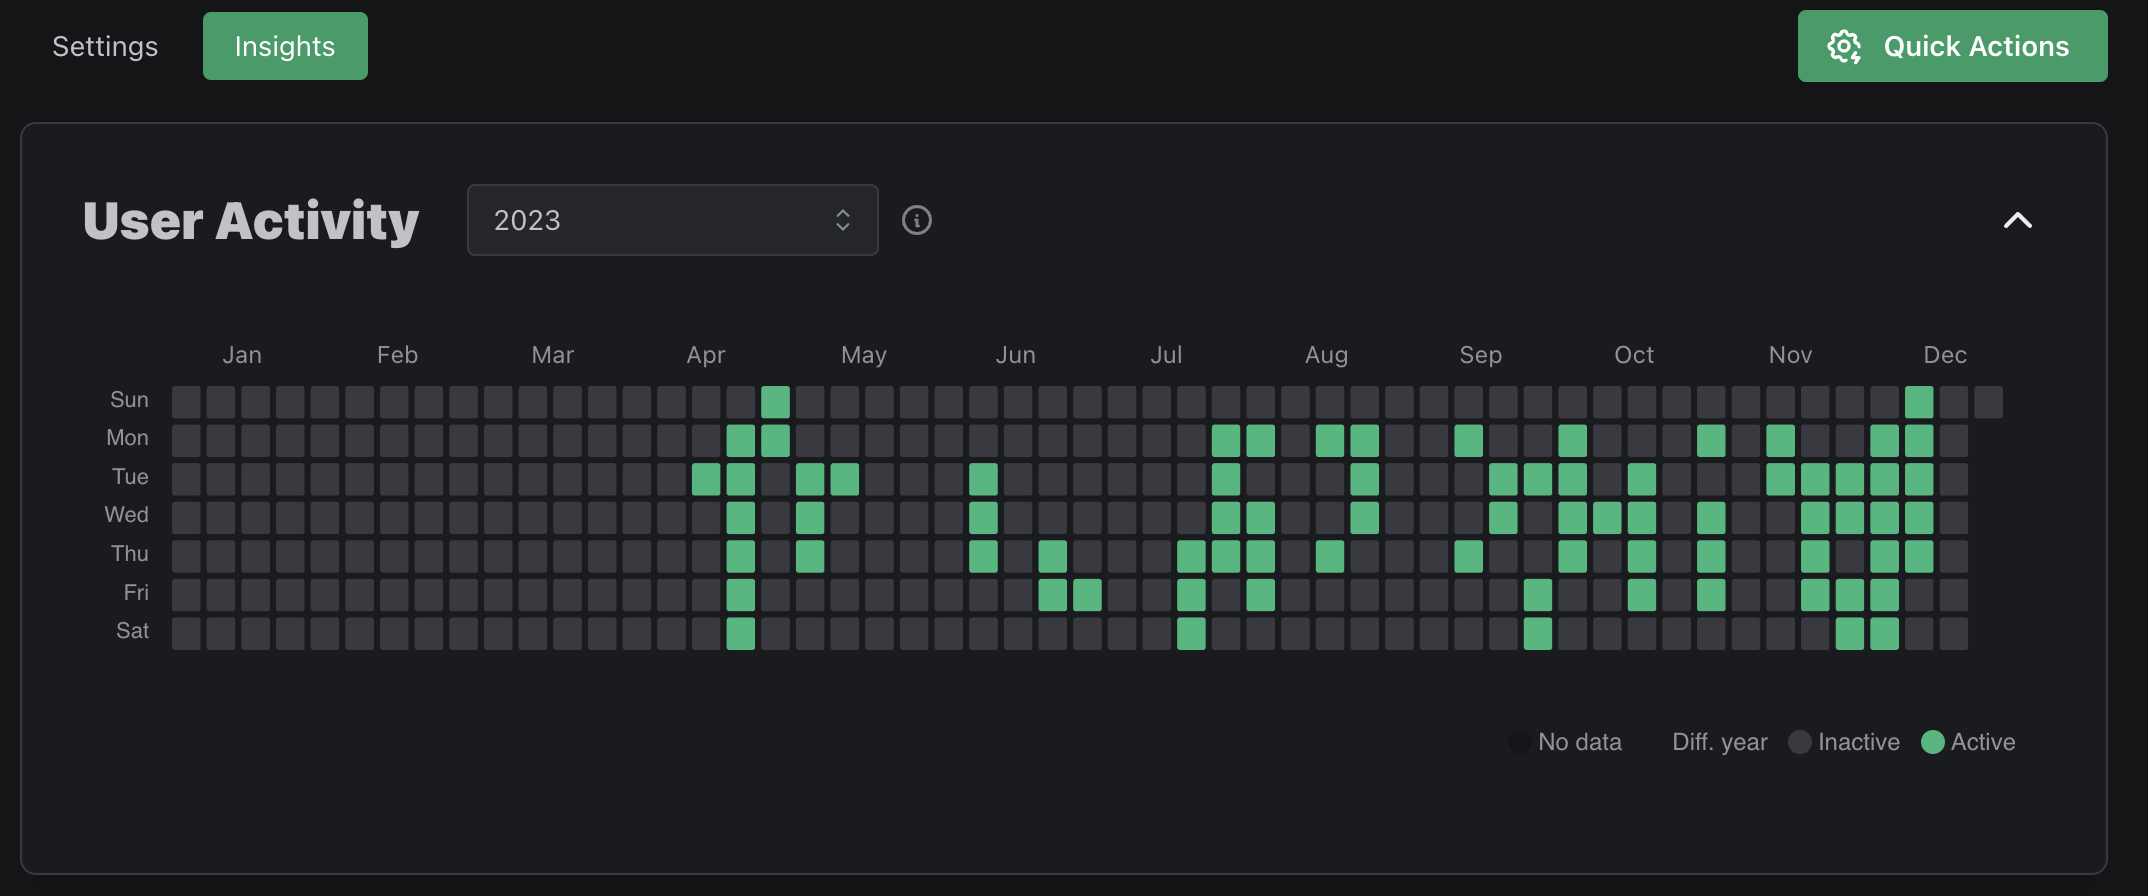
Each User profile has an Insights tab, which shows you their individual activity and any signup query parameters associated with them.
Charts & Reports
Navigating to the Data page of your PropelAuth dashboard followed by User Insights, you'll find a variety of charts and reports to help you understand your users. Alternatively, you can use the Insights APIs to fetch the data programmatically.
Charts
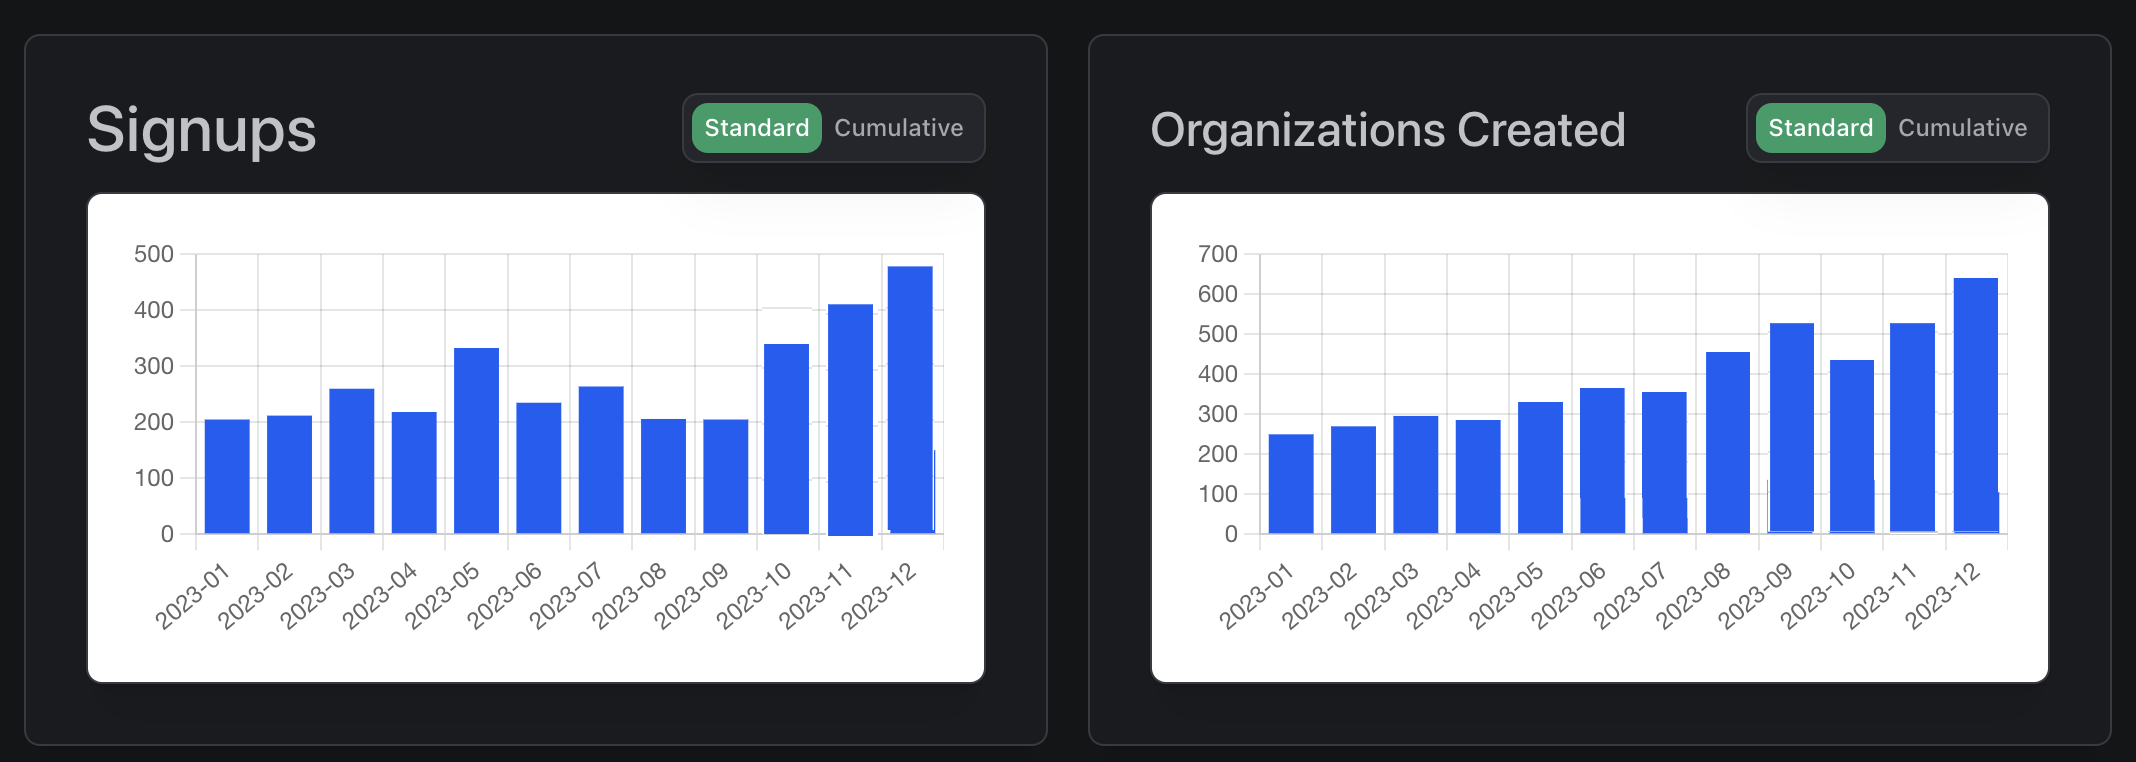
The following charts are available:
| Chart | Description |
|---|---|
| Signups | New users who either signed up directly or were created via th PropelAuth dashboard or API |
| Organization Created | New organizations, either created by your users, via your PropelAuth dashnoard, or via API |
| Active Users | Users who had activity in a period of time |
| Active Organizations | Organizations with at least one active user in a period of time |
Reports
Reports are a way for you to get lists of users or organizations that fall into certain categories. For instance, you may want to check the Churned Users report to see who you should prioritize reaching out to.
The following reports are available:
| Chart | Description | Timeframe |
|---|---|---|
| Churned Users | Users who have not been active in a certain amount of days | past 7, 14, or 30 days |
| Reengaged Users | Reecently active users who were previously inactive for a period of time | Weekly or Monthly |
| Potential Champions | Leaderboard of users with the highest amount of activity in a period of time | past 30, 60, or 90 days |
| Top Inviters | Leaderboard of users with the highest number of invited users in a period of time | past 30, 60, or 90 days |
| Churned Organizations | Organizations who had no active users in a period of time | past 7, 14, or 30 days |
| Reengaged Organizations | Organization with a recently active users who had no active users in a period of time | past 7, 14, or 30 days |
| User Signup Query Parameters | A report of signup query parameters associated with users in a period of time | past 30, 60 or 90 days |
| Organization Growth | Leaderboard of the organizations with the highest net growth over a period of time | past 30, 60 or 90 days |
| Organization Attrition | Leaderboard of the organizations with the highest number of users removed over a period of time | past 30, 60 or 90 days |
User Signup Query Parameters
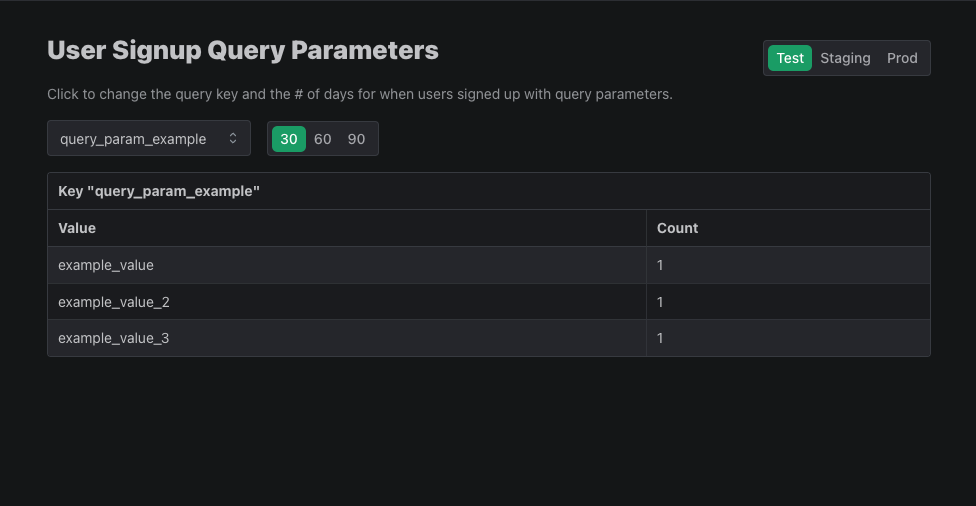
Add query parameters when directing users to signup to record where your users are being redirected from. Then, view those query parameters in your User Insights reports.
To use signup query parameters, add any parameter you would like to your signup URL:
https://{YOUR_AUTH_URL}/en/signup?query_param_example=example_value
You can then navigate to the User Signup Query Parameters report to view how many users have signed up using that query parameter as well as its value.
Alternatively, you can use our Fetch User Signup Query Parameters API to get the same information for each individual user.
curl --location --request GET '{YOUR_AUTH_URL}/api/backend/v1/user/{USER_ID}/signup_query_parameters' \
--header 'Authorization: Bearer {YOUR_API_KEY}'


// returns
{
    "user_signup_query_parameters": {
        "query_param_example": "example_value"
    }
}